Tracking AirNode hardware deployment across regions
Data current as of 5 July

AirNode sales reflect the number of physical units sold to operators each month. As the core infrastructure for last-mile wireless coverage, AirNodes are a direct indicator of network expansion and regional activation.
This analysis is part of the Monthly Metrics Analysis, with all figures sourced from the Ecosystem Metrics Dashboard.
Note: Sales include all AirNode types: Sparks, Titans, Apex, Portals and Links. You can participate in the netowrk infrastructure by purchasing them with Club.
Cumulative AirNodes Sold
45,316 units
Latest Trend and Analysis
![]() AirNodes Sold Asia
AirNodes Sold Asia
![]() AirNodes Sold USA
AirNodes Sold USA
![]() AirNodes Sold Total
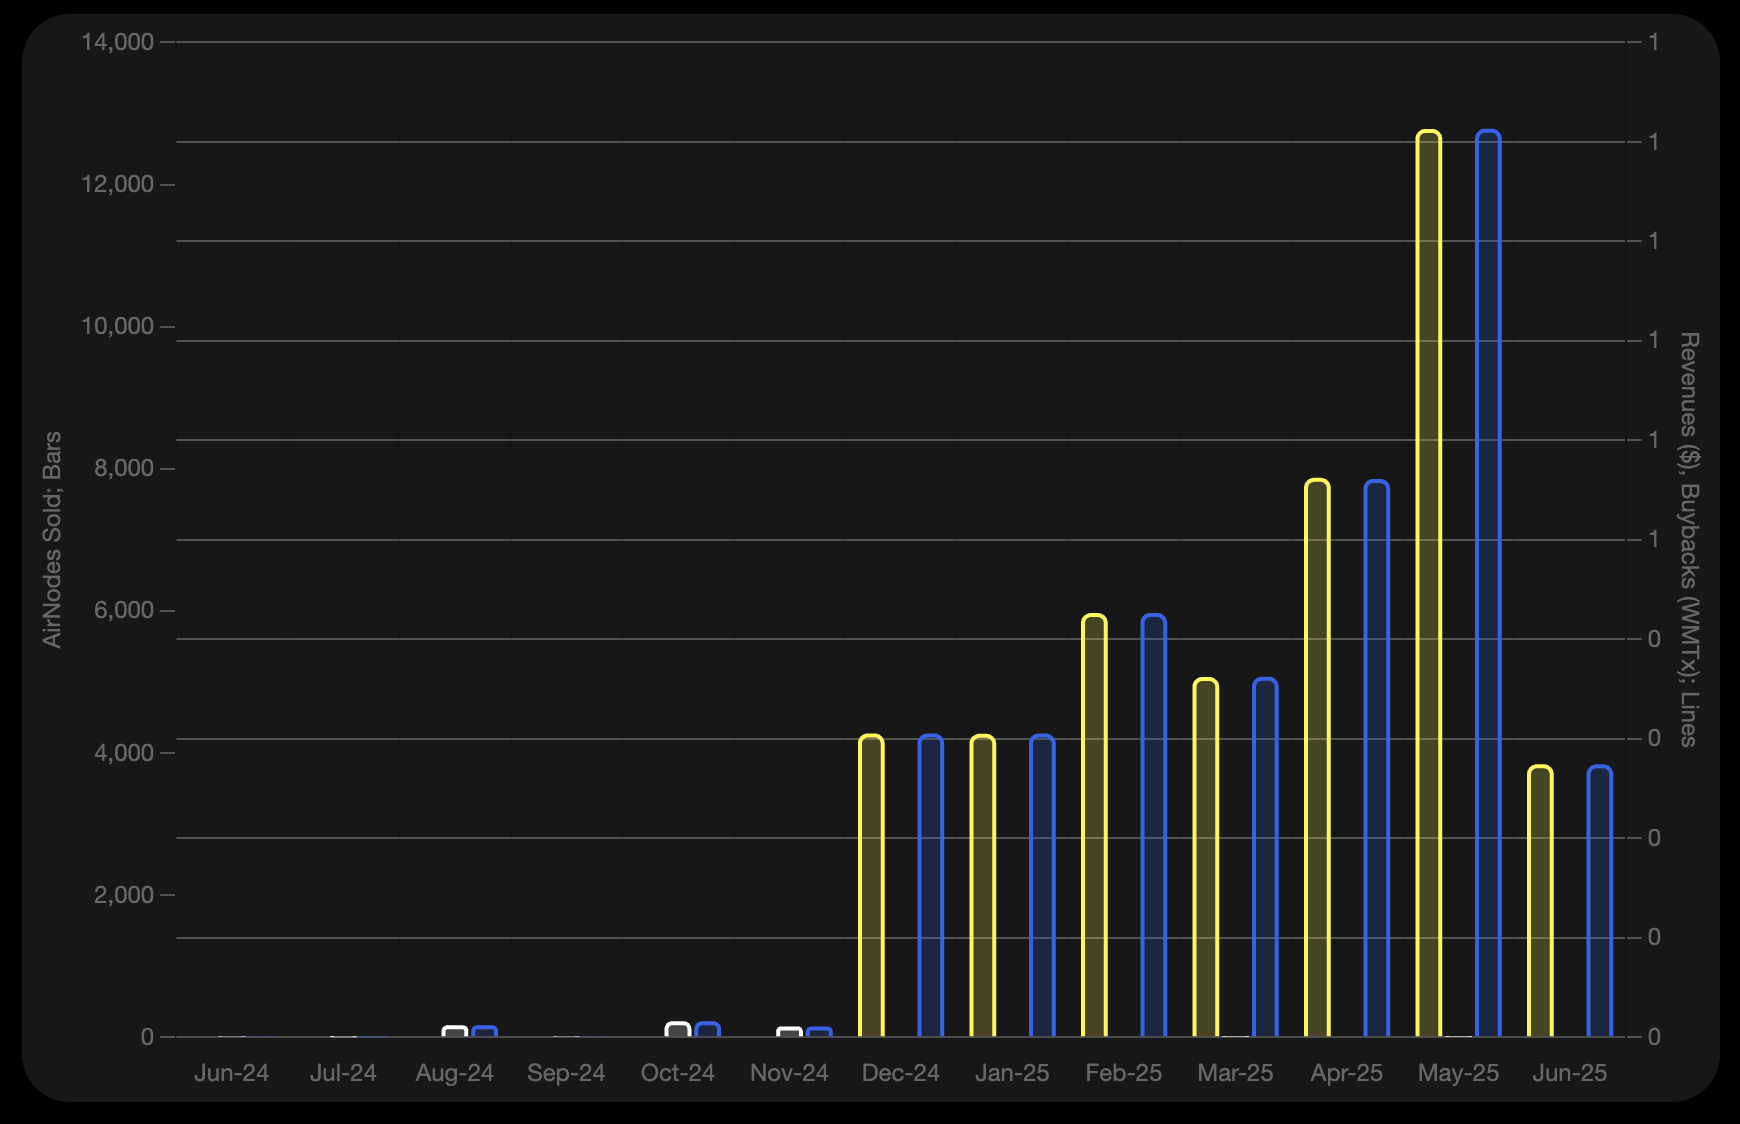
AirNodes Sold Total
AirNode sales saw their first major lift in December 2024, driven entirely by Asia. From there, monthly volumes climbed steadily through early 2025, peaking in May with over 12,700 units sold. In June, sales fell to 3,841, marking the first real slowdown in recent months.
The outlook remains strong. Actual on-the-ground deployments of Sparks are ramping up in Pakistan, and early indicators point to renewed growth in July. On the US side, AirNode sales have been minimal so far, but that is expected to change. With World Mobile Phone Plans rolling out in the US and the HD1 program launching in Q3, the second half of the year could bring a new phase of hardware adoption across both regions.
What the Data Shows
Here’s the month-by-month breakdown of AirNode sales over the past 12 months, including region-specific data and month-on-month growth. This helps highlight where deployment is scaling and where momentum has paused.
| Month | Total | Total MoM | Comment | Asia | Asia MoM | USA | USA MoM |
|---|---|---|---|---|---|---|---|
| Jun 2024 | 7 | — | — | — | 7 | — | |
| Jul | 1 | -86% | Sharp decline in US sales | 0 | — | 1 | -86% |
| Aug | 167 | +16600% | Spike in USA | 0 | — | 167 | +16600% |
| Sep | 6 | -96% | 0 | — | 6 | -96% | |
| Oct | 225 | +3650% | Another short burst in US activity | 0 | — | 225 | +3650% |
| Nov | 152 | -32% | 0 | — | 152 | -32% | |
| Dec | 4,275 | +2711% | Asia enters the picture | 4,275 | — | 0 | -100% |
| Jan 2025 | 4,270 | 0% | 4,270 | 0% | 0 | — | |
| Feb | 5,970 | +40% | Asia demand picks up again | 5,970 | +40% | 0 | — |
| Mar | 5,074 | -15% | Asia dips slightly | 5,070 | -15% | 4 | — |
| Apr | 7,872 | +55% | Strong growth in Asia continues | 7,872 | +55% | 0 | -100% |
| May | 12,785 | +62% | Asia surges, US still flat | 12,782 | +62% | 3 | — |
| Jun | 3,841 | -70% | Momentum slows after record May | 3,841 | -70% | 0 | -100% |
Per Month Analysis
January 2025 Snapshot
- Total AirNodes Sold: 4,270
Commentary: A flat month, nearly identical to December. No change in the US, and Asia held steady. Demand remained consistent without accelerating.
February 2025 Snapshot
- Total AirNodes Sold: 5,970
Commentary: A solid increase in Asia, adding 1,700 units. The US remained at zero. Deployment picked up momentum regionally.
March 2025 Snapshot
- Total AirNodes Sold: 5,074
Commentary: A slight dip from February, but still strong overall. Asia stayed active while the US reappeared with a minor uptick of 4 units.
April 2025 Snapshot
- Total AirNodes Sold: 7,872
Commentary: The highest month to date. Asia led with continued growth, while the US dropped back to zero. The broader trend remained positive.
May 2025 Snapshot
- Total AirNodes Sold: 12,785
Commentary: A major surge in Asia, pushing past 12,700 units. The US stayed low with only 3 sales. Total volume growth accelerated sharply.
June 2025 Snapshot
- Total AirNodes Sold: 3,841
Commentary: A sharp drop following May’s record sales. Asia slowed, and the US returned to zero. However, this does not reflect what’s happening on the ground. Deployments in Pakistan are accelerating and exceeding expectations. Spark sales are expected to rebound in the coming months.
Looking for the full picture? Explore how infrastructure translates into Network Revenue, or track EarthNode Buybacks. For everything in one place, visit the Monthly Metrics Page.